官方示例
OpenTelemetry 目前已经支持了全栈的Trace、Metrics和Logs的采集和处理,在Kubernetes集群中部署 OpenTelemetry Operator
可以帮助我们更好地管理和配置 OpenTelemetry 的相关资源
官方示例提供了一个完整的 Demo应用,可以体验 OpenTelemetry
的所有功能,项目地址
组件及项目架构
示例应用包含以下组件:
| 服务名 | 描述 | 语言 |
|---|---|---|
| Accounting Service | 记账服务,处理和计算订单数据 | Go |
| Ad Service | 广告服务 | Java |
| Cart Service | 购物车服务,依赖redis | .NET |
| Checkout Service | 结算服务,购物车 | Go |
| Email Service | 电子邮件服务 | Ruby |
| Frontend | 前端服务 | JavaScript |
| Load Generator | 负载生成器,可模拟压测 | Python/Locust |
| Payment Service | 支付服务 | JavaScript |
| Product Catalog Service | 产品目录服务 | Go |
| Quote Service | 报价服务 | PHP |
| Recommendation Service | 推荐服务 | Python |
| Shipping Service | 物流服务 | Rust |
| Image Provider Service | 图像提供服务 | 静态程序(nginx) |
| React Native App | React 原生应用 | React |
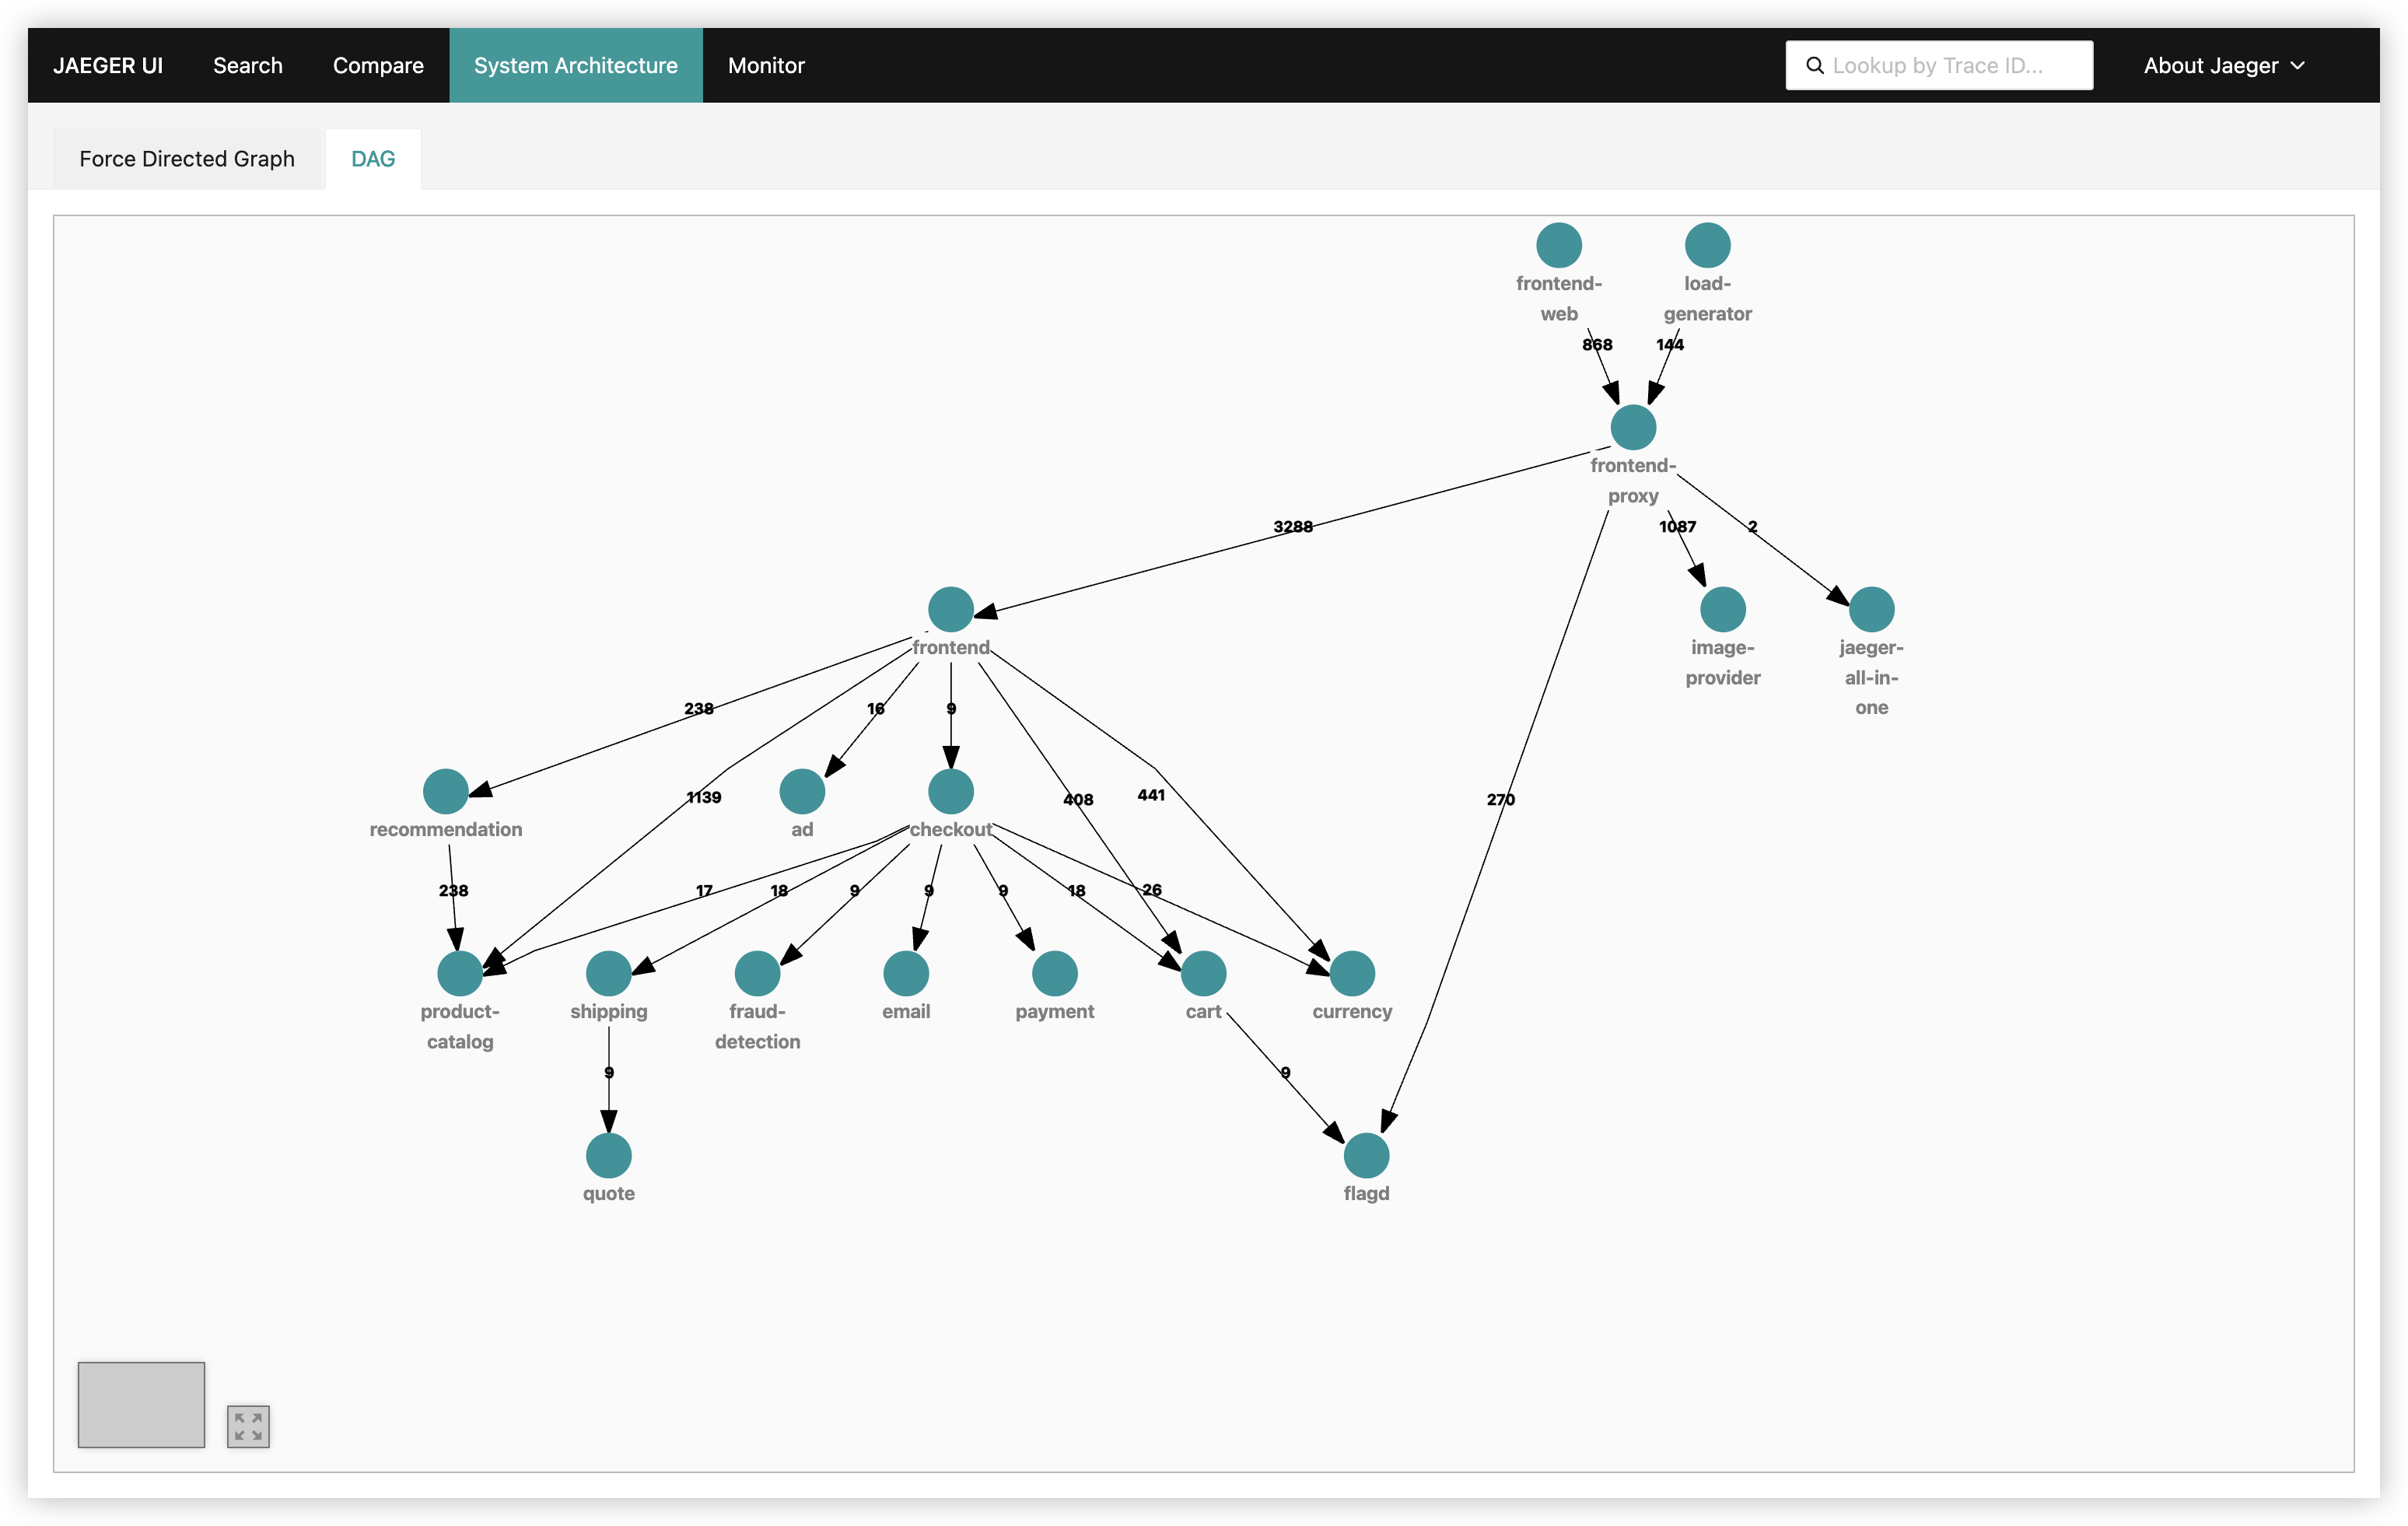
服务之间的关系(架构图及语言栈)如下:
Otel 数据流转关系
服务部署
参考官方文档 通过helm部署
~ helm repo add open-telemetry https://open-telemetry.github.io/opentelemetry-helm-charts
~ helm repo update
~ helm install otel-demo open-telemetry/opentelemetry-demo -n otel-demo --create-namespace
# 或者本地pull chart后再安装
~ helm install otel-demo . -n otel-demo --create-namespace
...
- All services are available via the Frontend proxy: http://localhost:8080
by running these commands:
kubectl --namespace otel-demo port-forward svc/frontend-proxy 8080:8080
The following services are available at these paths after the frontend-proxy service is exposed with port forwarding:
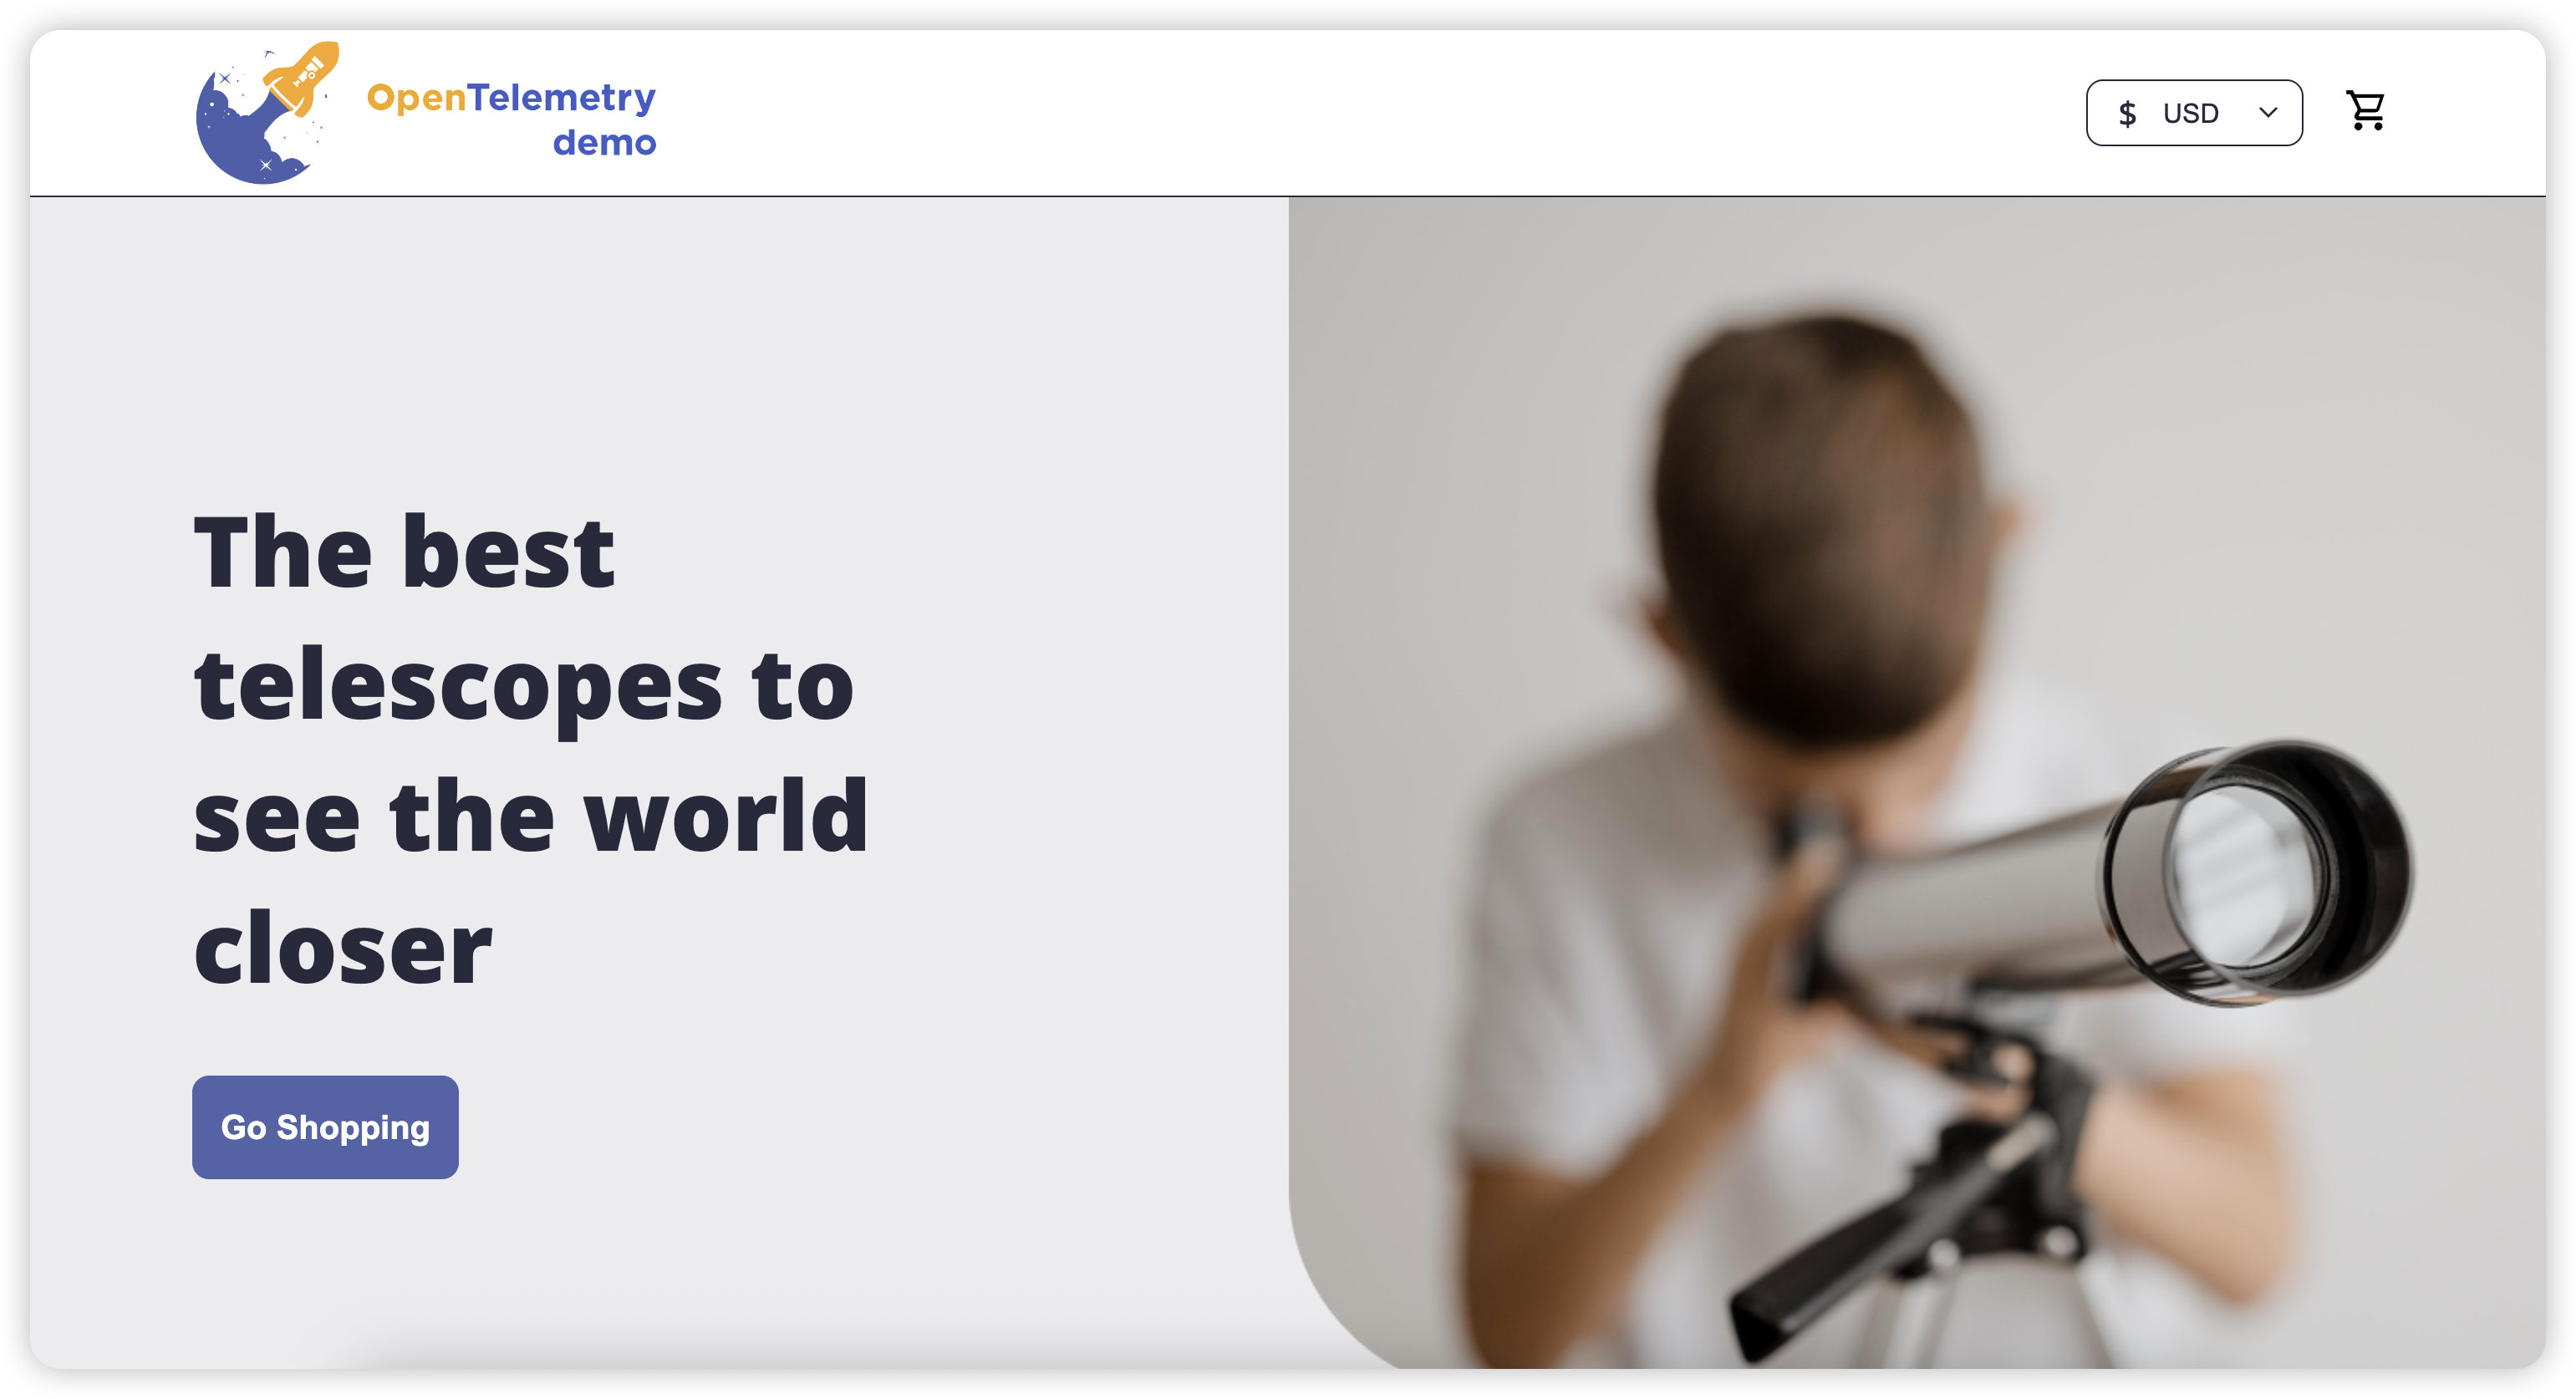
Webstore http://localhost:8080/
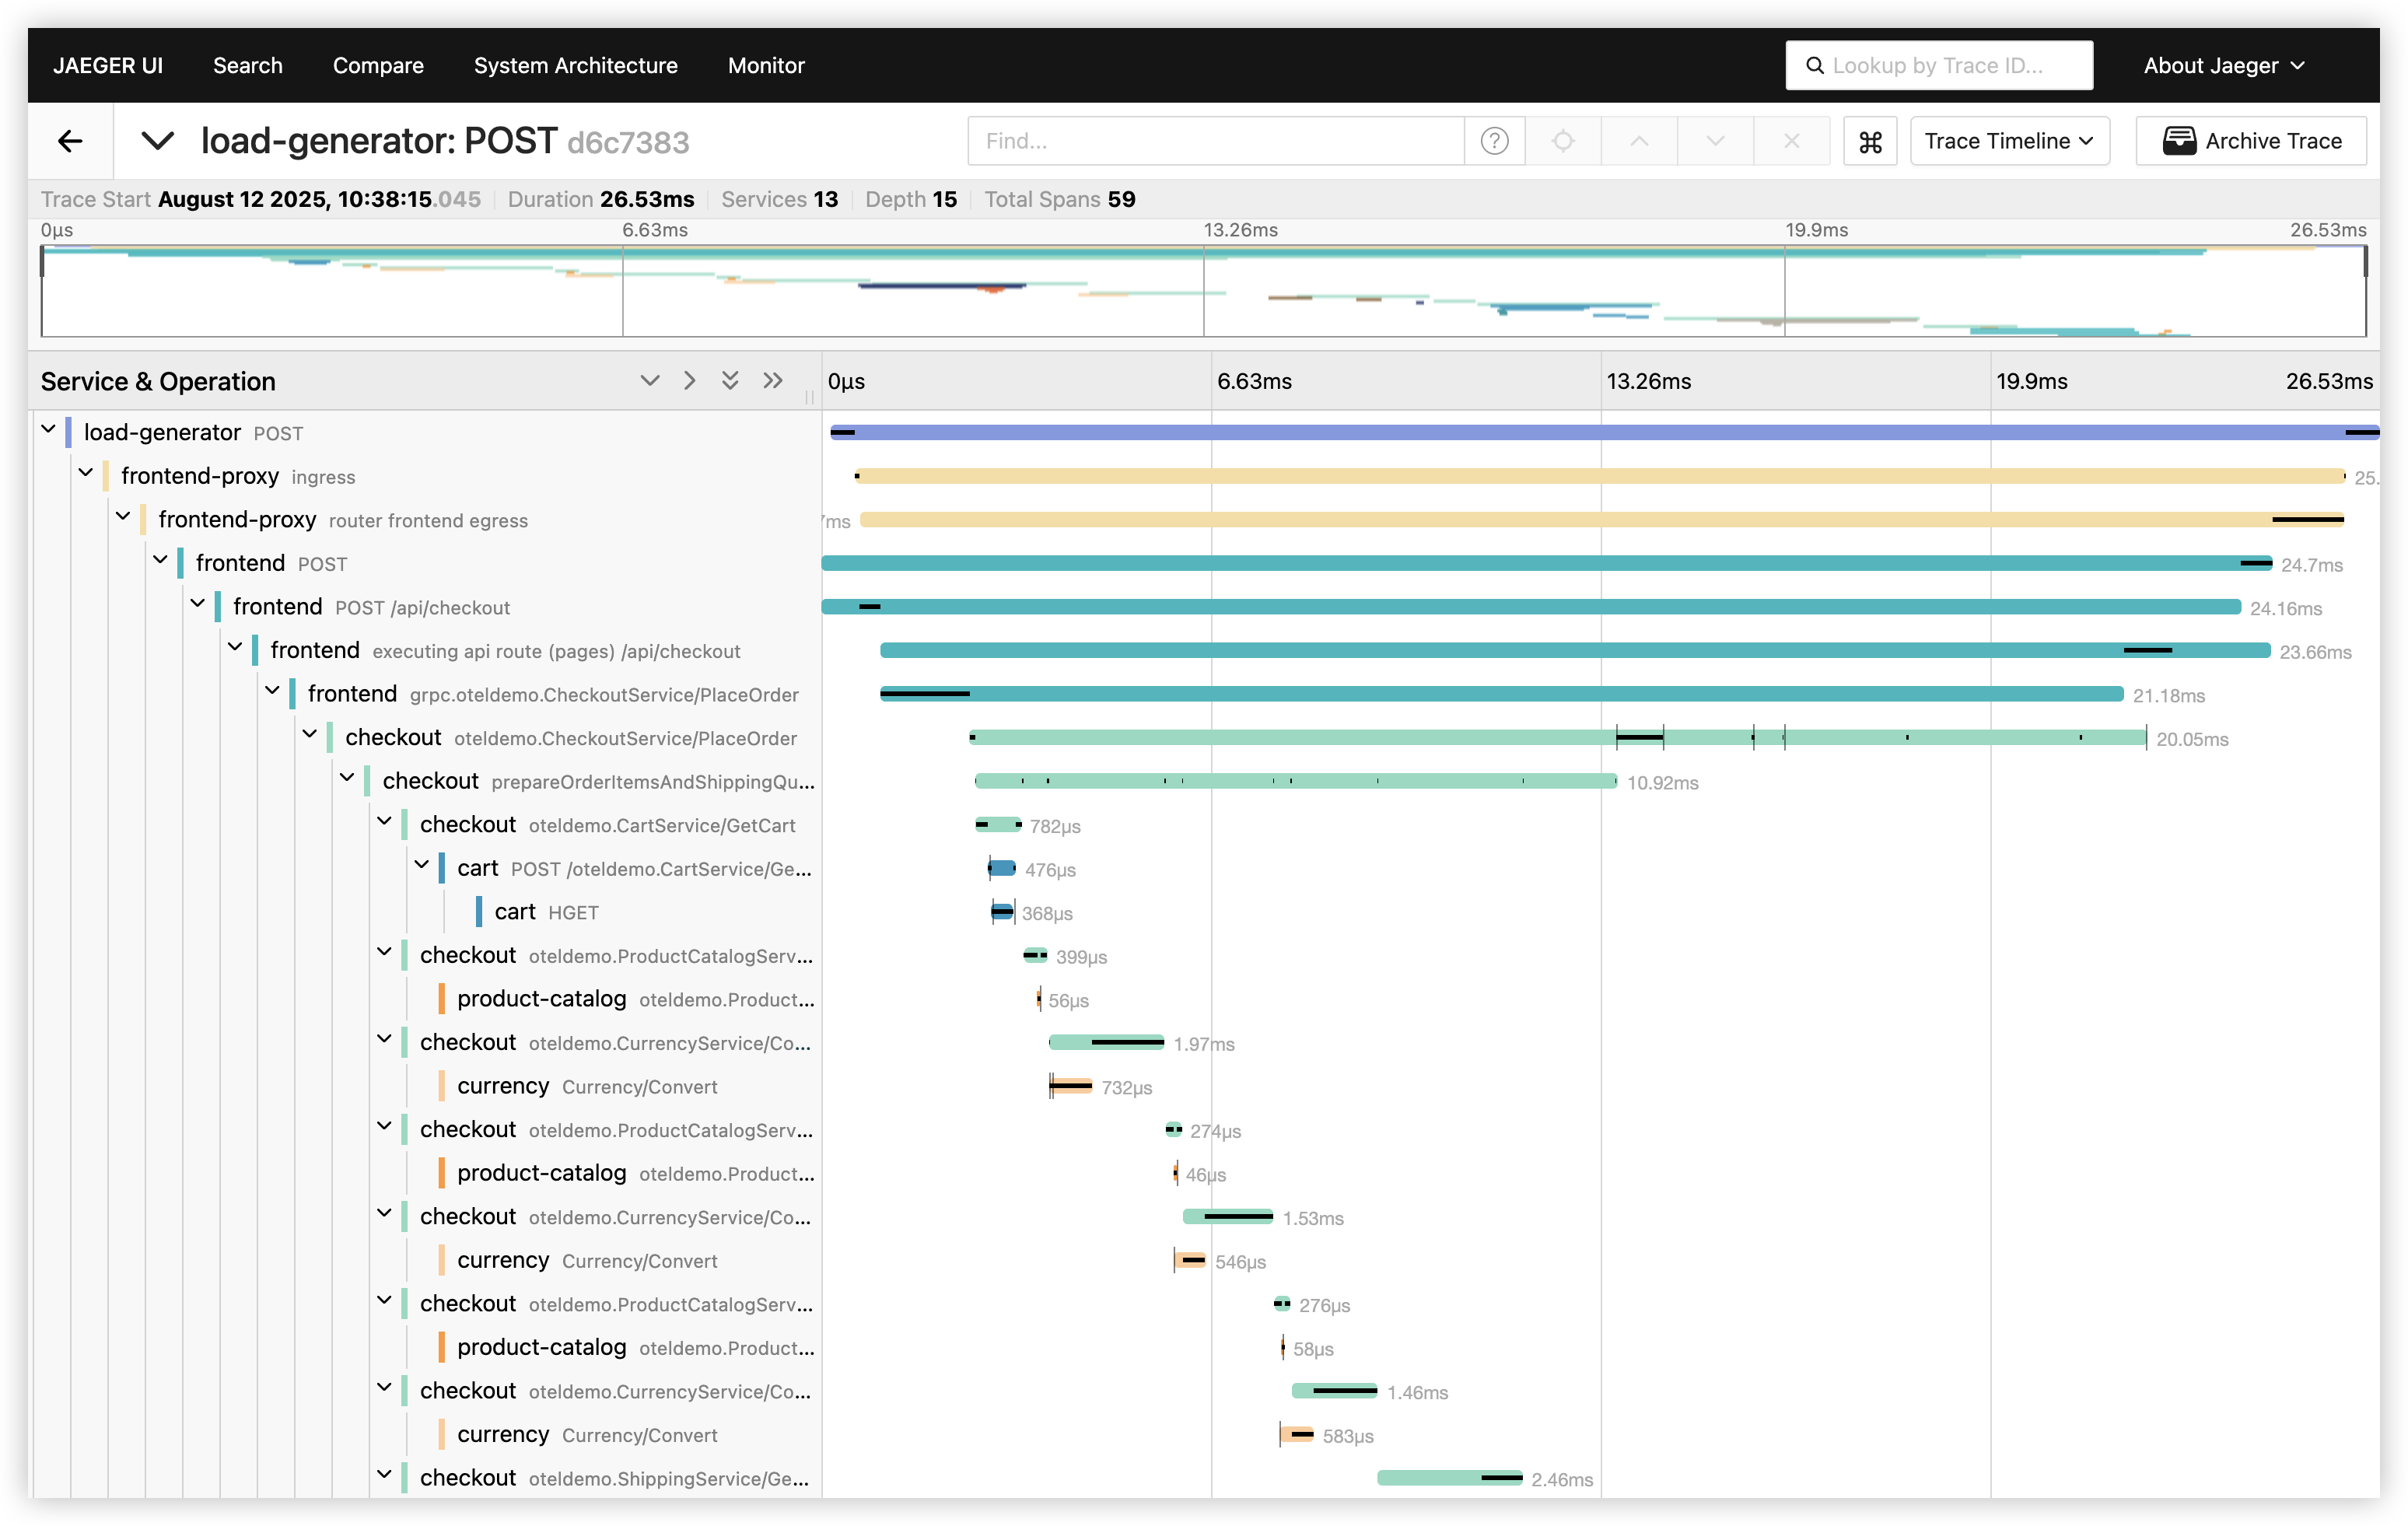
Jaeger UI http://localhost:8080/jaeger/ui/
Grafana http://localhost:8080/grafana/
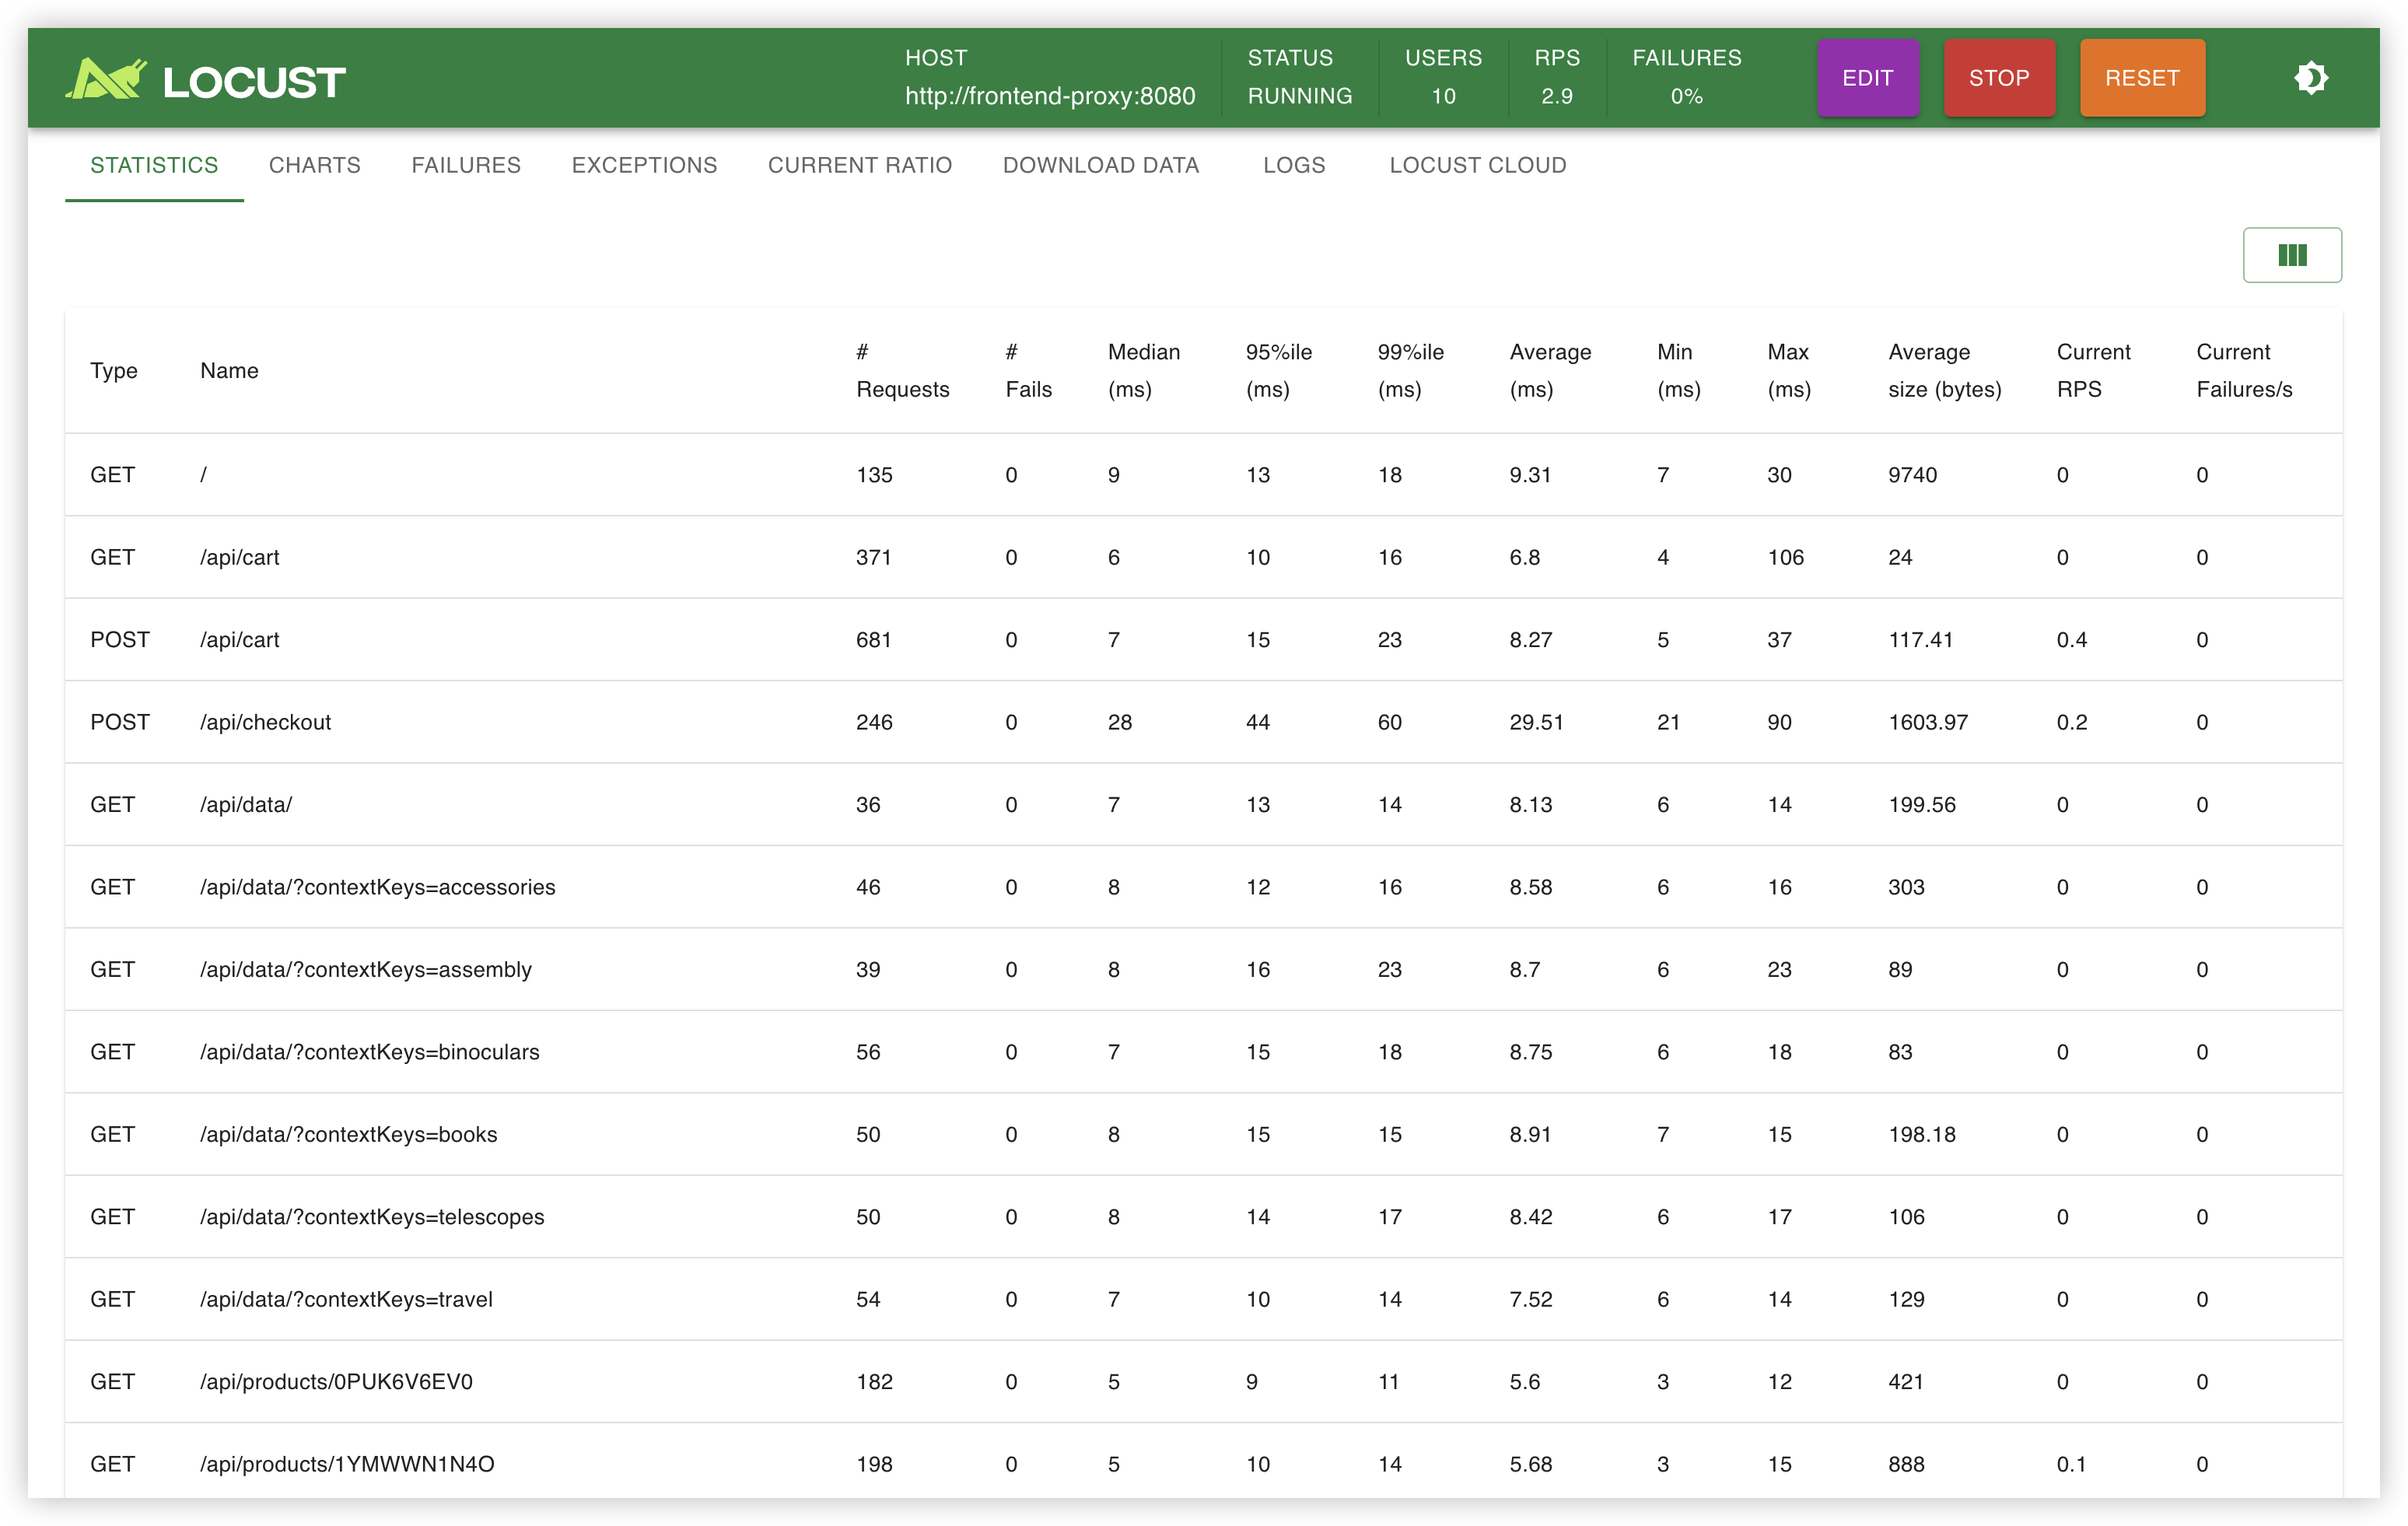
Load Generator UI http://localhost:8080/loadgen/
Feature Flags UI http://localhost:8080/feature/
访问测试
按照安装完成的提示,使用端口转发访问服务
~ kubectl --namespace otel-demo port-forward svc/frontend-proxy 8080:8080
访问 http://localhost:8080 即可看到前端页面
jaeger UI 访问 http://localhost:8080/jaeger/ui/
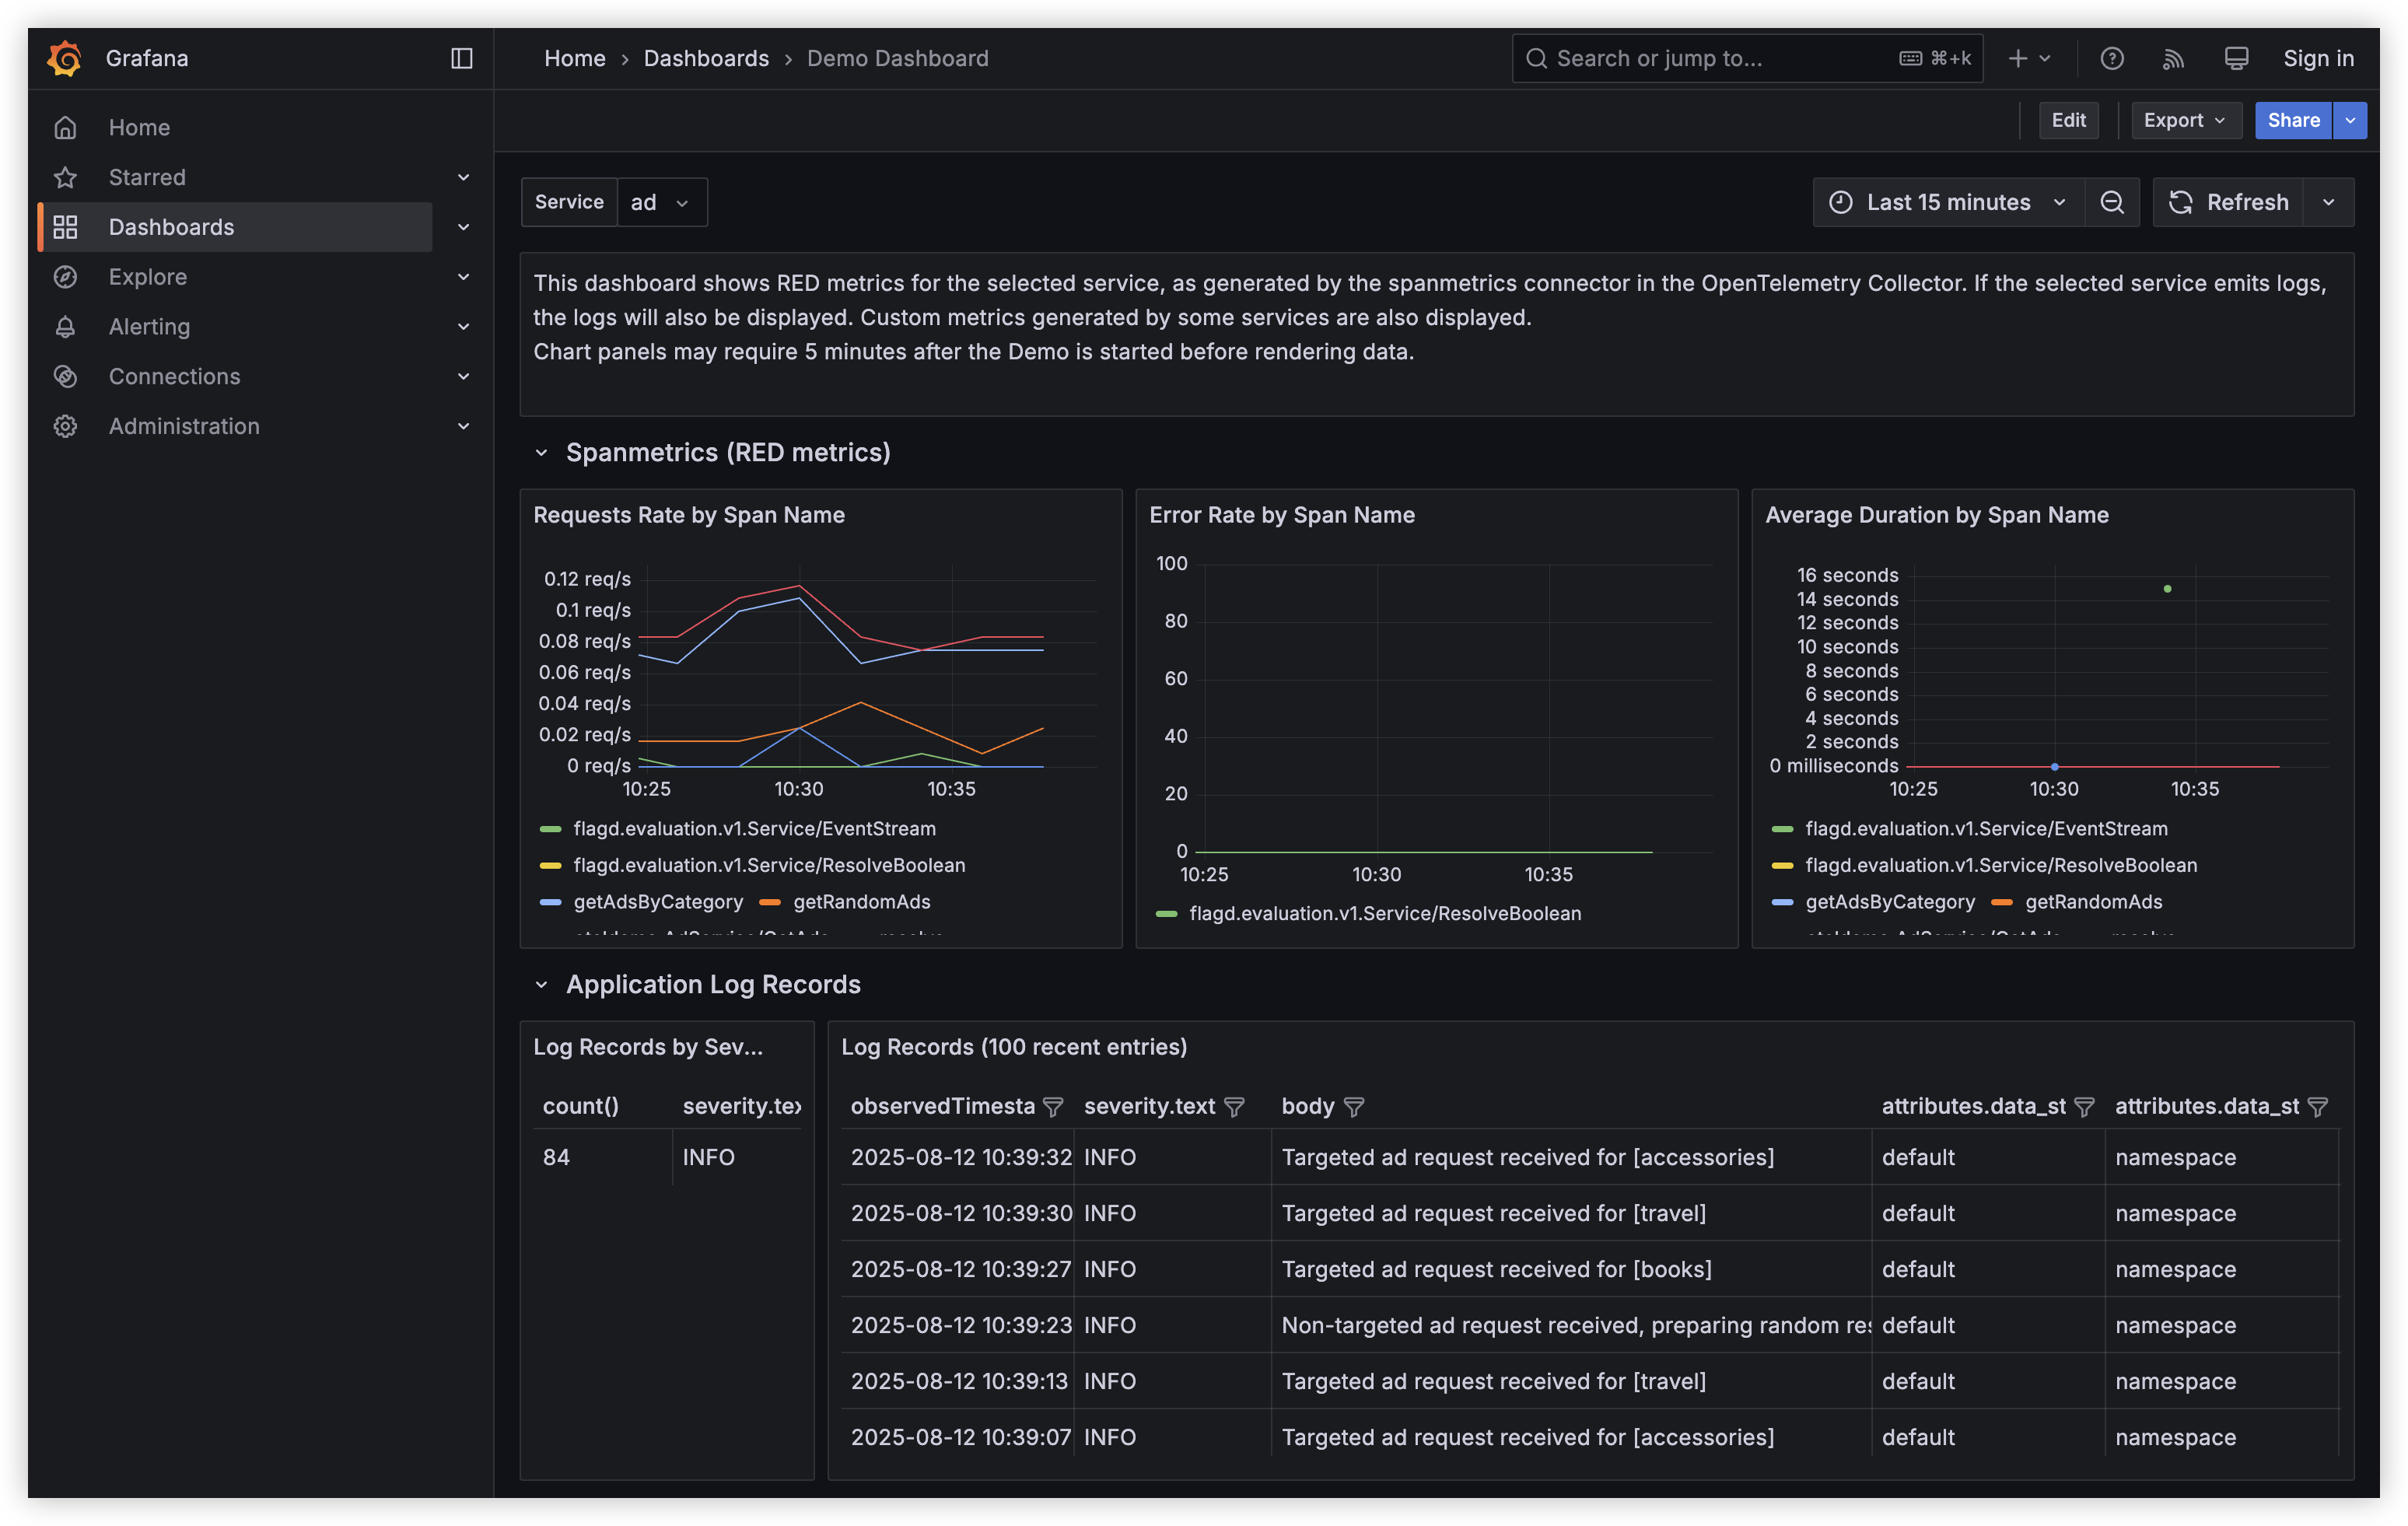
grafana UI 访问 http://localhost:8080/grafana/
load generator UI 访问 http://localhost:8080/loadgen/